

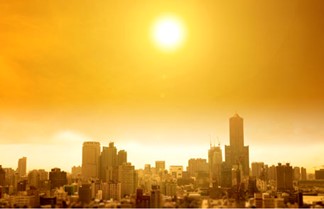
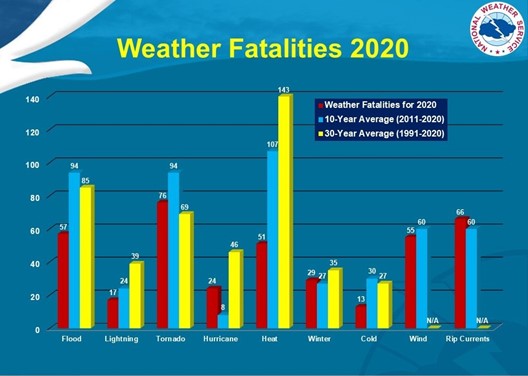
Virtually any populated area in the United States can experience an extreme heat event, including the northern most states (Figure 1). Also called heat waves, these events are increasingly common. They are predicted to continue to become more severe, more frequent, and longer in duration in the coming years (USGCRP 2017). Extreme heat is more than just uncomfortable weather; it is the deadliest of all weather-related hazards (Figure 2).
As climate change progresses, the likelihood of extreme heat events throughout the United States increases significantly, but the greatest increases are expected to occur in the typically cooler areas of the nation. Annual average temperatures across the contiguous United States have increased measurably when comparing data from the present day to the first half of the 20th century (Figure 3). The greatest increases observed have been in the northern and western regions of the nation.
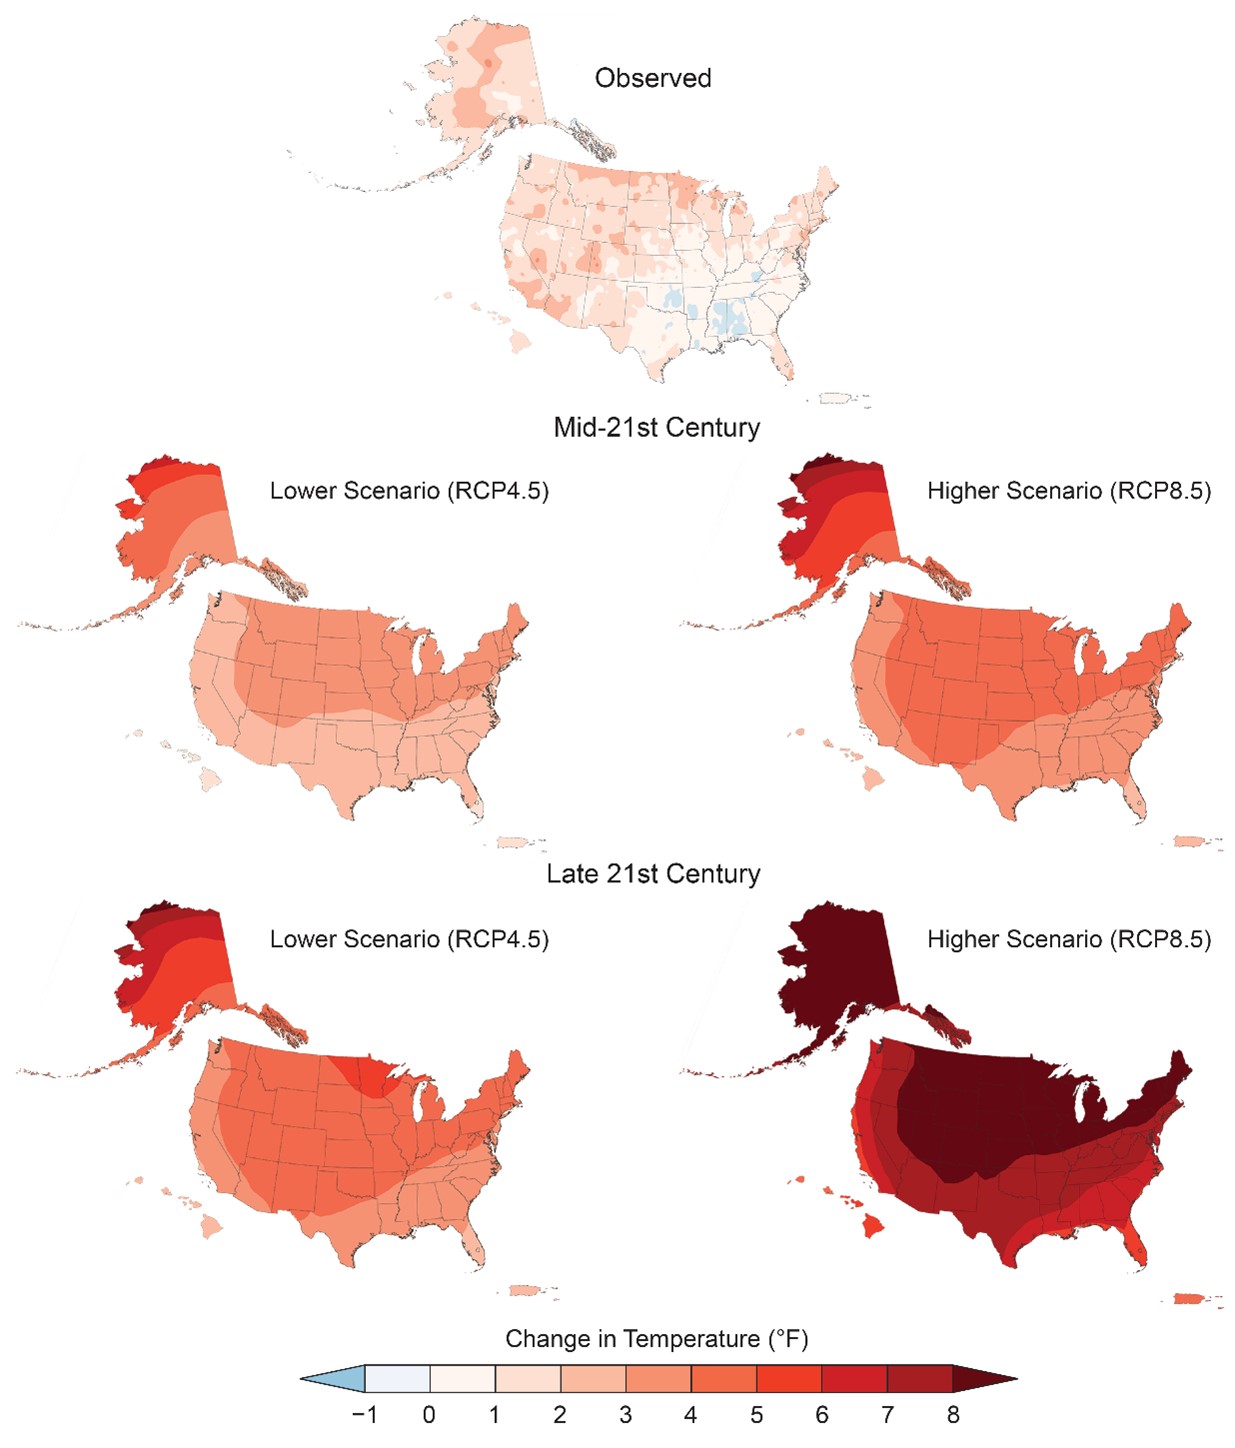
Predictive models indicate this trend will continue and accelerate. Climate scientists compare the results of models using both low and high greenhouse gas emissions in the future. The images on the left of Figure 3 show results from a lower greenhouse gasses model (RCP 4.5), while the images on the right show results when higher emissions are assumed (RCP 8.5). In either case, the temperatures experienced during the hottest years on historical record are predicted to become the norm over the next few decades (USGCRP 2018).
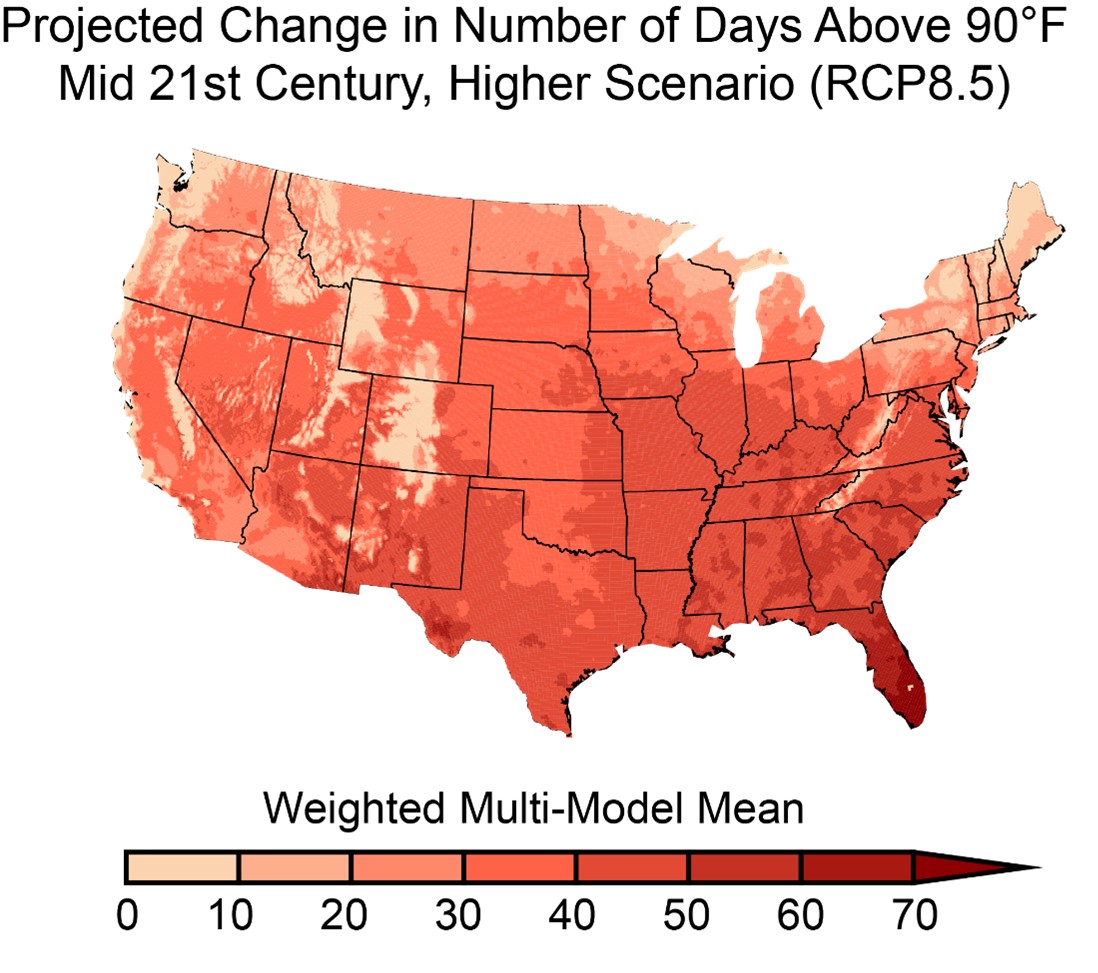
Extreme temperatures are predicted to increase at a faster rate than average annual temperatures. More than just a general year-round warming, the effect will be a significant increase in extreme heat events. Heat waves have been analyzed by predictive models to understand the expected increase in these events. Under a somewhat worst-case scenario (high greenhouse gas emissions), the temperatures experienced during extreme heat events can be expected to rise by at least 11°F by mid-century, with higher increases expected in the northern areas of the country (Table 1). These models also predict significant increases in the number of days per year that the temperature will exceed 90°F (Figure 4).
| Predicted Changes in Temperature Extremes from Near-Present Day to Mid-Century (High Greenhouse Gas Emissions Scenario) | ||
| National Climate Assessment Region | Change in Warmest Day of the Year | Change in Warmest 5-Day 1-in-10-Year Event |
| Northeast | 6.51°F | 12.88°F |
|
Southeast |
5.79°F | 11.09°F |
| Midwest | 6.71°F | 13.02°F |
| Great Plains North | 6.48°F | 12.00°F |
| Great Plains South | 5.70°F | 10.73°F |
| Southwest | 5.85°F | 11.17°F |
| Northwest | 6.25°F | 12.31°F |
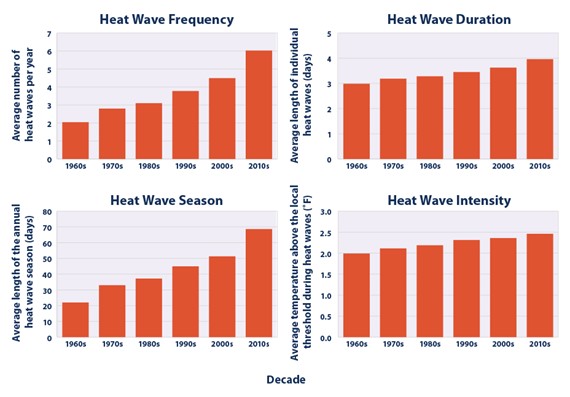
Extreme heat events are not only getting hotter, but more common and of a longer duration as well. This trend is already being observed today. The number of heat waves increased from an average of two per year in the 1960s to six per year in the 2010s. During the same time period, the average duration of extreme heat events has increased by about 1 day (Figure 5).
Notwithstanding these recent and predicted trends toward hotter, longer, and more frequent extreme heat events, it is important to note that the frequency of these events has varied significantly over the course of recorded history. The greatest frequency of extreme heat events on U.S. record occurred during the dust bowl of the 1930’s, significantly overshadowing the numbers of events in the 2010s (EPA 2021).
What is Extreme Heat?
An extreme heat event can be loosely defined as a period of days during which the weather is much hotter than would be typical for summertime in a given area. There are no universally accepted threshold temperatures or humidity levels to establish an extreme heat event. This is because local weather norms and the local population’s level of adaptation to high heat play an important role in the impact of an event. An extreme heat event in Alaska can happen at lower temperatures than one in Florida, but the health risks to the population can be just as real.
Extreme heat is not related to temperature alone, but to humidity levels as well. Higher humidity impedes the body’s ability to cool itself through evaporation. The Heat Index, developed by NOAA, combines heat and humidity into a single value to represent how hot it feels under specific conditions. This is a valuable metric in understanding how hot and humid weather is experienced by the human body.
Extreme Heat Risks
Extreme heat can cause heat cramps, heat exhaustion, heat stroke, and death in otherwise healthy people. It can also exacerbate existing health conditions such as cardiovascular disease, respiratory disease, and diabetes. The populations at greatest risk in an extreme heat event are young children, people over 65, people with physical or cognitive impairments, people who are homeless or living in poverty, and those who live alone without air conditioning (CDC 2021).
Extreme heat has ramifications beyond the immediate risk to human health. Increased use of air-conditioning can strain the electrical grid, potentially causing power outages and brownouts (voltage drop in the grid). The potential loss of power can exacerbate the health risks due to the loss of air-conditioning, refrigeration, and fans. Use of air-conditioning will also increase energy costs for homeowners and increase pollution.
Extreme Heat and the Built Environment
The built environment plays a key role in both exacerbating and mitigating extreme heat. On the one hand, buildings, roads, and parking areas tend to measurably increase local temperatures through what has been termed the urban heat island effect, and the energy used in buildings contributes to climate change. On the other hand, air-conditioned buildings offer the most practical and effective refuge for people needing to escape extreme heat.
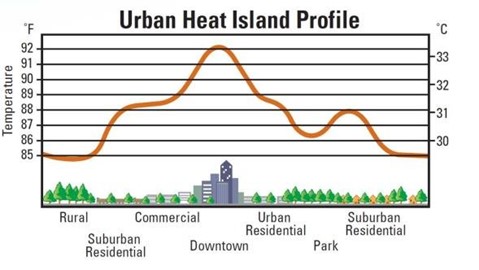
The urban heat island effect is the well documented concept that areas with a high density of buildings and pavement get measurably hotter during the day than more vegetated areas. These urban areas also stay warmer through the night. The primary causes of this effect are due to the facts that traditional pavements and roof finishes absorb a high percentage of incident sunlight, limit natural evaporative cooling by quickly shedding rainwater and limiting transpiration of ground moisture to the air, and retain heat well into the night due to their high thermal mass and dense configuration. It has been found that this effect produces temperatures which can be 1-7°F warmer during the day and 2-5°F warmer at night (Figure 6).
Buildings and urban landscapes can be designed or retrofitted to reduce the urban heat island effect. First, increasing vegetation of any sort will have a cooling effect due to less solar absorption, more shading, and increased evaporation. Water features will similarly have a local cooling effect. Permeable pavement allows moisture from rainwater to be absorbed and then re-evaporated. Cool roofs, green roofs, cool walls, and cool pavements can all result in a significant lowering of local temperatures by minimizing the amount of solar energy that is absorbed.
Buildings act as the primary means of protection for people during an extreme heat event and can be designed to aid that purpose. With or without electricity, buildings can provide shade from the sun as well as temperature regulation through thermal mass, insulation, air sealing, and operable windows and doors. With electricity available, buildings can provide air conditioning, air movement (fans), and refrigeration as means of cooling occupants, as well as air filtering to mitigate heat-related respiratory aggravation. Finally, with plumbing, buildings provide an additional suite of highly effective cooling strategies including cool showers, damp coverings, misting or sprinkling, and, most importantly, potable water for drinking.
All of the aspects of homes that provide protection from extreme heat add up to the "hours of safety" that a home can provide. "Hours of safety" refers to how long a home can provide safe conditions for occupancy during an extreme heat or extreme cold event if the power were to go out. Every home has a different number of hours of safety that it can provide during a particular event, based on the specific characteristics of the home. A well-shaded home will provide more hours of safety during extreme heat than a similar poorly shaded home; new homes tend to provide more hours of safety than older homes due to better windows, more insulation, and better air-sealing.
Strategies for builders, designers, and homeowners to help extend a home's hours of safety and prepare it for extreme heat are listed in the Design for Extreme Heat information guide. Below are immediate actions a person can take during an extreme heat event.
Actions Home Occupants Can Take During an Extreme Heat Event
The following are basic strategies to help keep yourself and your home cool during a heat wave.
- Get familiar with the warning signs and emergency actions for heat-related illness (see CDC guidance).
- Use air-conditioning or go to a place with air-conditioning (central air conditioning, window unit, portable unit).
- Use an evaporative cooler if you are in a low-humidity region.
- Use fans when indoor air temperature is below 95°F.
- Shade windows during the day.
- Open windows at night and use fans to bring in night air (if it is cooler outdoors than indoors).
- Move to the lowest floor or shady side of the house.
- Create a temporary cool zone in the lowest and most shaded area, isolated from the rest of the house by plastic sheeting, cardboard, etc.
- Wear lightweight, light-colored, and loose-fitting clothing.
- Drink cold water and fluids without caffeine, sugar, or alcohol.
- Take a cool shower or bath.
- Place damp towels around neck and back.
- Sleep in a hammock.
- Consider sleeping outdoors if cooler outside than inside.
- Eat light, cool, refrigerated foods such as fruit or salads.
- Keep cooking equipment, the dishwasher, clothes dryer, gaming systems, lights, and other equipment turned off.
- Use bath and kitchen exhaust fans to remove heat and humidity from bathing and cooking.
Extreme Heat Guides
The following guides provide information on making a home safer and more capable of weathering an extreme heat event.
Design
Roof/Attics/Ceilings
- Air Sealing, Insulating, and Venting Attics and Roofs to Reduce Heat Gain
- Cool Roofs and Walls to Reduce Heat Gain
- Attic Radiant Barriers
- Vented vs Unvented Attic
- Calculating Attic Passive Ventilation
- Disaster-Resistant Roof Venting
- Attic Ventilation Fans
Walls/Windows/Doors
- Shading and Solar Control for Windows and Skylights
- Window Attachments for Solar Control and Energy Efficiency
- High-Performance (ENERGY STAR) Windows
- Low-E Exterior Storm Windows
- Interior Storm Windows and Panels
- Exterior Doors are Insulated, Impact Rated, and Fire Rated
- High-Thermal-Mass Construction
- Air Sealing and Insulating Walls to Reduce Heat Gain
Operations/Equipment
- Mechanical Air Conditioning
- Traditional Split Heat Pumps
- Ground-Source Heat Pumps
- Ductless (Mini-Split) Heat Pumps
- Evaporative Cooling Systems
- Ceiling Fans (Energy Star)
- Whole-House Fans
- High MERV Filters
- Emergency Air-Conditioning and Food Refrigeration
- Generators for Back-up Power During Outages
- PV Battery Storage for Power Outages
Foundation/Site
More Info
References and Resources*
* For non-dated media, such as websites, the date listed is the date accessed.
Contributors to this Guide
The following authors and organizations contributed to the content in this Guide.