

Scope
Use indoor air quality (IAQ) sensors to monitor and address air quality concerns in the home. Some examples of IAQ sensor implementation are:
- Short- and long-term monitoring of general building air quality
- Short- and long-term monitoring of localized air quality or of specific pollutants
- HVAC (heating, ventilation, and air conditioning) filter monitoring
- Ventilation system control such as:
- Range hood operation (smart range hoods or aftermarket range hood sensors)
- Bathroom fan operation (smart switches or aftermarket bathroom fan controls)
- Stand-alone room air cleaner operation (integrated sensors)
- Central HVAC fan operation
- Ventilation intake damper control
- Garage exhaust fan control (carbon monoxide sensors)
See the Compliance tab for links to related codes and standards and voluntary federal energy-efficiency program requirements.
Description
Research in recent decades has greatly improved our understanding of the quality and composition of the air that we breathe in indoor environments. Energy efficiency efforts in the 1980’s often led to tighter building envelopes, resulting in lower natural ventilation rates. Reports of dizziness, nausea, upper respiratory problems, and even reduced mental health – now referred to as “sick building syndrome” – prompted earnest efforts to understand the nature of indoor air quality (IAQ) and its relationship to energy conservation measures.
As we tighten the envelopes of our homes to reduce infiltration, we also trap pollutants generated within the home. One answer to this pollutant build-up is to displace stale indoor air with a continuous supply of fresh air from outside and add a single filter to air handling units. This proactive approach can optimize and control ventilation, which is far more comfortable and more energy-efficient than relying on infiltration through gaps in building assemblies.
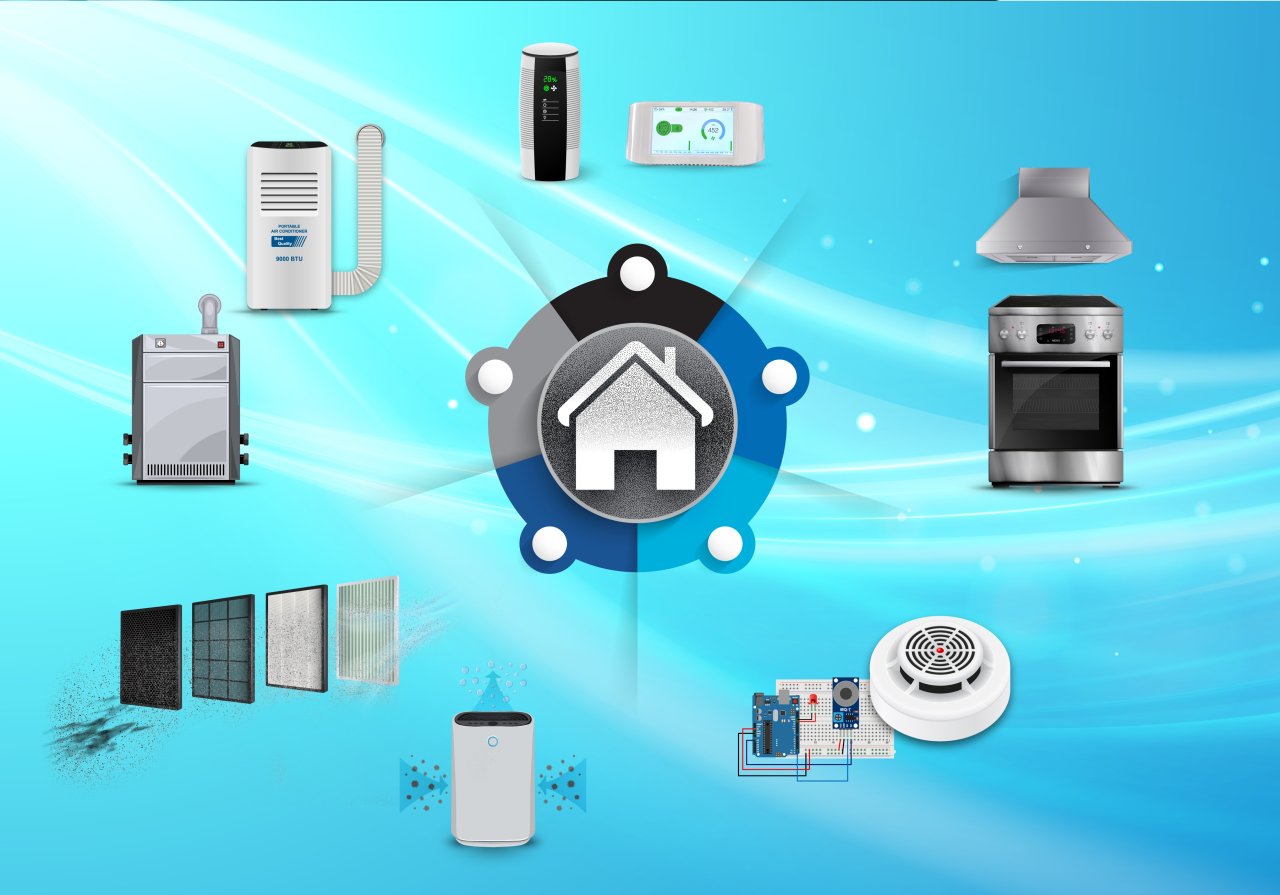
Numerous consumer-grade indoor air quality sensors have entered the consumer market in the past decade or so (Figure 1). They are often small enough to fit in a person’s hand and can be installed inconspicuously within other devices or can be wall-mounted. Some devices are intended for monitoring indoor air only, while others are specifically intended for outdoor use, although some are marketed as being able to do both.
It should be noted that, although these sensors have value, as of 2025 these products are unregulated and their performance varies. Still, IAQ sensors can be integrated into HVAC (heating, ventilation, and air conditioning) controls to improve indoor air quality. This guide serves as an introduction to common indoor air pollutants, ways to mitigate exposure, and methods for integrating IAQ sensors into ventilation controls.
Source
What Information Do Sensors Provide?
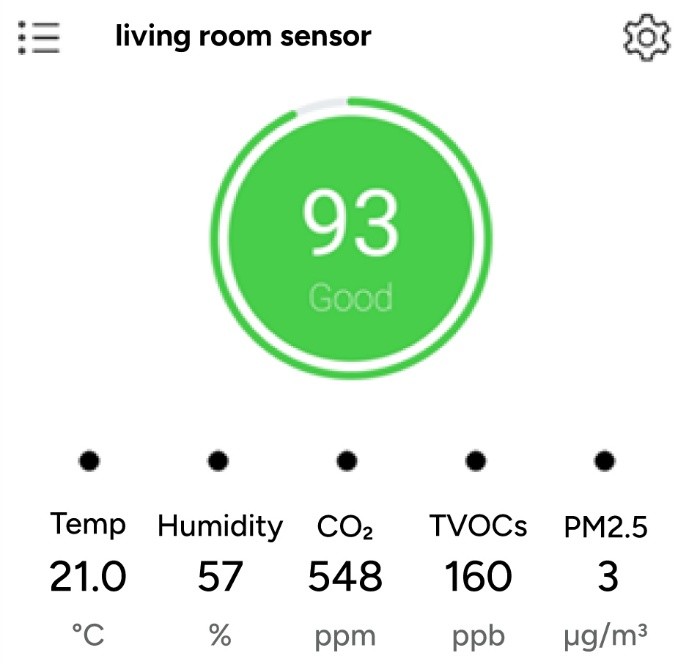
Some IAQ sensors measure a single component in the air, while others measure several at once. Proper operation of these sensors begins with understanding what the sensors are measuring and how to interpret the output. Figure 2 shows an example of the reading or graphical output of an IAQ sensor. In most cases, what is reported by the sensor is either:
- Concentrations of individual pollutants, typically in micrograms per cubic meter (mg/m3) for particles and parts per million (ppm) (or occasionally parts per billion (ppb)) for gases.
- A summary of the overall air quality using either color indicators or a numerical scale.
Figure 2 also shows an example of both types of sensor readings. The concentration of each pollutant is shown at the bottom, and the overall air quality value is indicated by the green circle with “93” inside. The numerical value is a metric created by the sensor manufacturer that reports overall air quality normalized for a 0-to-100 numerical scale (where higher is better), and the color corresponds to the universal green-yellow-red (go-caution-stop) convention. These overall metrics incorporate many assumptions and weighting factors and should be viewed skeptically.
Source
Common Pollutants in Indoor Air
Common pollutants that are measured by many IAQ monitors include particles and gases. These are described in the following sections.
Particles
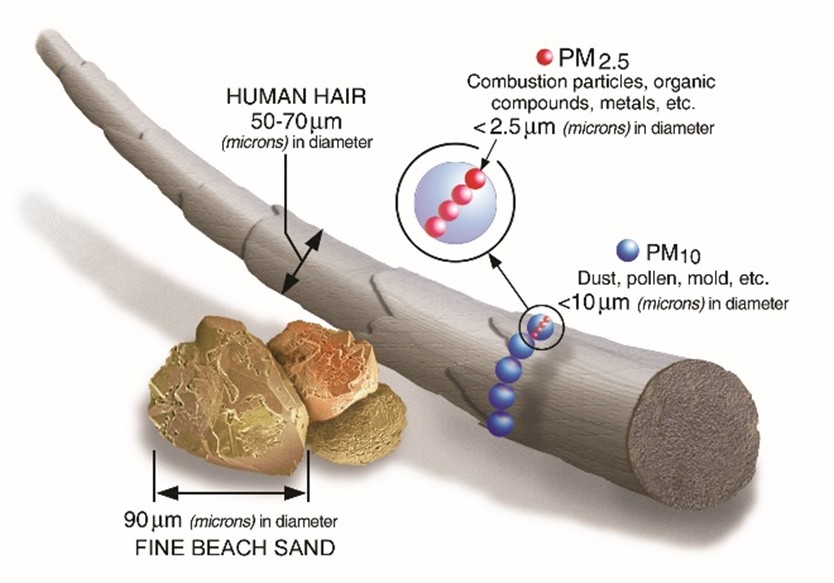
Most consumer particle monitors report mass concentration of particulate matter (PM) in one or more size bins, with concentrations typically reported as micrograms of particles per cubic meter of air volume (mg/m3). PM size categories are reported with subscripts designating their typical particle diameter in micrometers (µm) (Figure 3).
Source
Article describing particulate matter (PM), what it is, how it can be harmful, and what can be done about it.
The two particle sizes reported by most consumer-grade indoor sensors are:
- PM2.5 is sometimes called “fine particles.” Fine particles found indoors are typically generated by combustion from sources such as gas stoves or cigarettes.
- PM10 is sometimes called “large particles” or “dust.” These particles are of more concern for acute effects such as watery eyes and allergies. Particles of this size are more likely to be visible and include but are not limited to, household dust, pollen, and road dust.
Like all consumer-grade sensors, particle sensors have inherent inaccuracies. However, particle sensors tend to be more accurate than those measuring gases.
Typical concentrations of fine particles in indoor environments might be:
- 1-3 µg/m3 in well-ventilated homes with good central filtration during normal operation (not during cooking or other emission events).
- Up to a few thousand µg/m3 during a cooking event (especially if dinner burns) for short periods of time, followed by a 1-2 hour return to normal concentrations.
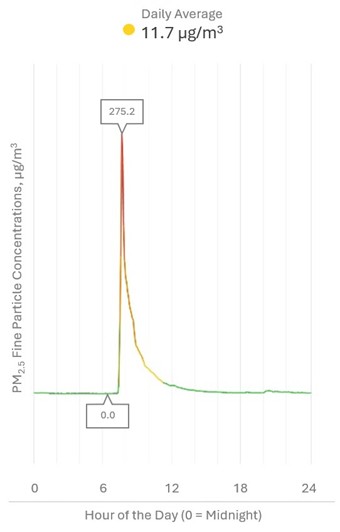
As an example of typical particle concentrations, Figure 4 shows fine particle concentrations measured in a home with a consumer device before, during, and after a cooking event. This is a typical fluctuation in indoor particle concentration and not a cause for concern.
Source
As can be seen, the concentration is low before cooking, rises significantly during cooking, and then returns to normal levels within a few hours of the event, which is typical. Also shown on the display of this device is a daily average, e.g., the analogous daily concentration if this was the only incidence of elevated production of fine particles in a full 24-hour period. To reduce either the peak concentration or the daily average, the homeowner could:
- Remove other sources of particulates in the home, including smoking, candles, incense, and unvented gas cooking.
- Reduce the number of times per week that cooking of this sort is done and monitor the cooking process frequently to avoid burning.
- Regularly use a kitchen range hood that is ducted to the outside (not a microwave-integrated recirculating fan), on a high setting, starting just before cooking and continuing until particle concentrations return to low levels (usually within 30 minutes after cooking).
- Use specified MERV rated filters and change central heating and cooling system filters regularly according to manufacturer guidance.
- Consider supplementary stand-alone HEPA (high efficiency particulate air) filtration if the issue persists. These should be placed in the areas of the home with the greatest concentrations, typically near the source of the particles.
For more information on actions you can take to reduce your exposure to indoor PM, see the EPA's Indoor Air Quality portal.
Gases
Gases that are often tracked by IAQ monitors include carbon dioxide, carbon monoxide, and volatile organic compounds.
Carbon Dioxide (CO2)
Next to particles, the most commonly reported metric measured by consumer IAQ sensors is carbon dioxide (CO2), a colorless, odorless, non-flammable gas. CO2 is naturally generated by occupants breathing. It is also a byproduct of combustion, and can also be generated by off-gassing of CO2 from the use of dry ice for chilling and packing products, or even from volcanic eruptions.
The concentration of CO2 in a home can indicate:
- The relationship between the number of people in the home and the amount of ventilation
- If many people are present in a small space, even a well-ventilated home will have high CO2 concentrations.
- If the home is poorly ventilated, CO2 concentrations may be high even with only a few people present.
- The likelihood that human bioeffluents, such as body odor, are noticed or considered offensive by occupants. Very high CO2 concentrations are typically correlated to high concentrations of bioeffluents, and vice versa.
CO2 concentrations will not indicate:
- Concentrations of other pollutants, e.g., particles generated during cooking, off-gassing from building materials and consumer products, or allergens from pets and dust,
- The performance of the home’s ventilation system,
- How HVAC filters are performing,
- Exposure to airborne pathogens, such as viruses.
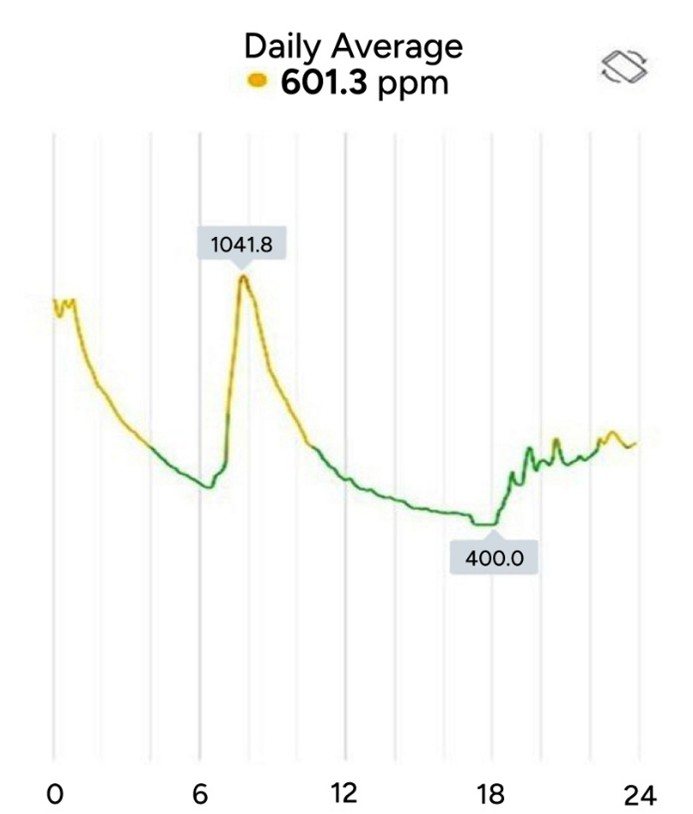
CO2 is typically reported in parts per million (ppm). Proper targets for CO2 concentrations are the subject of much debate. Traditionally, 1,000 ppm has been used as a target steady state CO2 concentration for properly ventilated buildings. The scientific basis of this 1,000-ppm threshold is disputed and some ventilation standards use steady state concentrations well above this. Despite lack of a consensus, indoor concentrations between 700-1,200 ppm has been established as a maximum by several relevant authorities and is expected to result in acceptable air quality for most people. Figure 5 shows an example of CO2 concentrations fluctuating throughout the day in a home, with “0” on the horizontal axis as midnight and “12” as noon. When occupants and combustion sources are not present, CO2 concentrations should approach outdoor “background” concentrations, which are typically 300 to 400 ppm (0.03% to 0.04%) though metropolitan areas may have background readings of 600 to 900 ppm.
Source
For the example shown in Figure 5, this device was located in a living room on the first floor of a two-story home, with bedrooms on the second floor. It should be noted that:
- When occupants wake up and start cooking breakfast (6 hours), the CO2 concentration quickly rises from its nighttime minimum concentration to over 1,000 ppm.
- After occupants leave for work, the concentration decays to close to outdoor concentrations (assumed by this device to be exactly 400 ppm).
- When they return from work around 6 pm (18 hours), concentrations rise again.
- The daily average concentration reported by this device is less useful because it includes many hours when the occupants are not present.
These fluctuations are considered normal and not a cause for concern.
Carbon Monoxide (CO)
Carbon monoxide is toxic, but also colorless and odorless. Combustion appliances, such as gas stoves, gas water heaters, and gas furnaces, as well as fireplaces can be sources of CO in the home. As a result, there are many commercially available indoor CO monitors that will alert residents if unsafe levels of CO are detected indoors.
Additionally, CO sensors can be used to enhance the operation of mechanical exhaust in multifamily shared garages. This is discussed in more detail later in this guide.
For more information on carbon monoxide and how to limit your indoor exposure, see the EPA's Indoor Air Quality portal.
Volatile Organic Compounds (VOCs)
In general, gases called volatile organic compounds (VOCs) can be of concern in indoor environments, but are much harder to measure individually using devices currently for sale to the general public. Hundreds of VOCs have been identified; these include gases emitted from consumer products such as hair spray and nail polish, ethanol from cleaning products, paint, and gases from building materials such as formaldehyde emitted by engineered wood. Cooking can also generate some gases of concern such as formaldehyde and acrolein.
Our noses are excellent at detecting the presence of VOCs, but cannot measure their concentrations or determine whether or not what we are smelling is actually harmful. There are many VOCs whose odor you might recognize – the smell of gasoline or new carpet, for example. VOC molecules are diffused in the air and can be detected by sensors.
Because few devices can accurately measure the concentrations of the plethora of unique VOCs, many affordable gas detectors available for retail purchase instead report a total concentration, designated “tVOCs.” Unfortunately, tVOC monitors do not actually measure all the VOCs present, but are calibrated prior to sale based on a subset of “expected” gases. Their output is more a supposition than an actual measurement because it imputes the presence of gases and their proportions based on a signal calibrated with a small set of unknown reference gases. Additionally, some VOCs are harmful even in low quantities, such as formaldehyde which is considered by OSHA (the Occupational Safety and Health Administration) to be a carcinogen at concentrations as low as 16 parts per billion. Others, such as ethanol, are considered acceptable at concentrations up to 1000 parts per million. This enormous variation in acceptable concentrations means that an aggregate value has no real meaning.
Because VOCs are very difficult to accurately and reliably measure with consumer-grade sensors, some EPA-recommended methods to reduce indoor exposure to VOCs in your home without the use of sensors are listed below.
- Ventilate your home when using cleaning products, either by providing mechanical ventilation (such as an exhaust fan) or by opening a window.
- Never mix cleaning products unless directed by the manufacturer.
- When purchasing products such as paint, paint strippers, kerosene, or gasoline, only buy as much as you will use right away to avoid the need for storing half-empty containers indoors. VOCs can still leak from closed containers.
For additional information on VOCs, including their associated potential health effects and additional ways to reduce your indoor exposure, see the EPA's Indoor Air Quality portal.
Ventilation Design and Maintenance to Improve IAQ in Homes
The following design and maintenance recommendations can support good air quality in homes and public spaces:
- In all cases, the most cost-effective and reliable way to improve IAQ is to eliminate sources of indoor pollution before it enters the home. Best practices for this include:
- Eliminate sources of combustion in the home to the degree possible, including gas or propane stoves and appliances,
- Ensure that intakes for ventilation systems, if present, are located away from any sources of outdoor pollutants such as loading docks, parking areas, or building exhaust outlets. For specific requirements regarding ventilation intake locations, see the International Mechanical Code (IMC).
- Install range hoods and bathroom fans directly above or near the source of pollutants, with the proper fan capacity and duct sizing, and always exhaust directly to the outside.
- Use specified MERV (minimum efficiency reporting value) rated filters and replace filters in central forced air conditioning systems regularly per manufacturer instructions. Use stand-alone HEPA filtration units in problem areas as needed.
- Use ASHRAE Standard 62.2 to inform your ventilation design. These methods are designed to maintain acceptable indoor CO2 concentrations when occupants are present.
Monitoring
In some cases, we want information about how our homes are performing over time, and long-term monitoring with consumer devices may be appropriate for this application. This can take a few forms, discussed below.
Long-term monitoring for Baselining and Rating
The first class of applications is long-term monitoring of building air quality. This can be done for baselining purposes to compare across housing stock or within communities or for rating purposes to identify buildings with good air quality. In these applications, average pollutant concentrations are of interest, rather than short term changes in concentrations. Long-term monitoring can also be useful to measure relative differences of before-and-after measurements of retrofits to verify that ventilation equipment upgrades or air-sealing efforts are providing the desired performance.
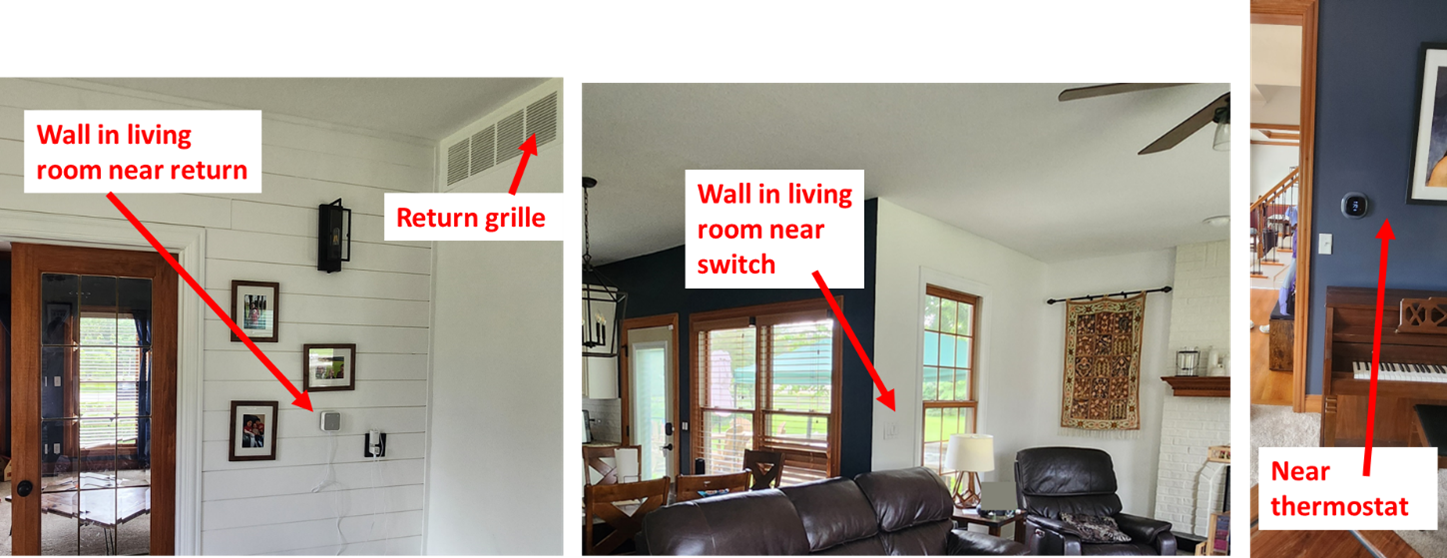
Proper sensor placement will change with application. If a homeowner or builder wants a general assessment of the home’s air quality, then sensors should be placed:
- In the rooms where occupants spend the most time
- At the level of the typical occupants’ breathing zone (mouth and nose)
- Away from pollutant sources such as stoves and cleaning supply closets
- In a place where graphical output can be read if desired
- In front of the return duct (provided that it is away from pollutant sources, is accessible to power, not aesthetically offensive, and can easily be read by occupants). When the HVAC system is designed properly, return air is assumed to be a well-mixed sample of the living space air.
Potential sensor locations are shown in Figure 6. It should be noted that pollutant concentrations are expected to vary within the home from one room to another. A single static sensor will give less information than multiple, strategically placed sensors. If one desires a full picture of the exposure of occupants to pollutants of interest, then multiple sensors should be installed.
Source
Filter Monitoring
Long-term monitoring may also be done to measure the performance of an HVAC filter. A few in-duct products are sold to measure upstream and downstream particle concentrations to assess filter performance (Figure 7, right). Typically, this involves installing a particle sensor upstream of the filter in the large part of the return duct and another in the large part of the supply duct (Figure 7, left). Well-functioning filters should reduce the concentration of fine particles between these two points by at least half. If this is not the case, consider replacing the filter. You should also look for gaps where air is bypassing the filter, and for sources of particles within the furnace cabinet, such as dusty coils.

Source
It should be noted that in-duct monitors are often marketed as “whole-house” monitors. One may be tempted to put sensors in a return duct for whole-home monitoring because the return airstream is effectively an “average” of all the rooms of the home that are manifolded into this duct. However, this is not advisable for several reasons:
- The duct itself may be a source of particles, and thus concentrations will be elevated above those the occupants are exposed to.
- Concentrations in rooms with high or frequent occupancy are substantially diluted by air from other rooms, and thus sensor readings in the return duct may not reflect concentrations that occupants actually experience.
- Dust in ducts will shorten the life of the sensors.
- The air in return ducts is not necessarily representative of the air in occupied rooms because the only time air is being circulated in most homes is when a call for heating or cooling is sent by the thermostat to the central equipment fan. In some cases, particularly in the shoulder seasons in mild climates, days or weeks may pass without a call for heating or cooling, rendering sensor measurements during these periods meaningless.
For these reasons, monitors located in rooms that are often occupied are better indicators of occupant exposure and thus preferable to in-duct monitoring for long-term accounting of IAQ. In-duct monitoring should be used to test the effectiveness of the filter at removing particles.
Integrating IAQ Sensors With Ventilation Controls
Consumer-grade IAQ sensor signals can be used as inputs to a controller for a ventilation device in a home. This can include a few applications, discussed below. These applications are also summarized in Table 1 at the end of this section.
Smart Range Hoods
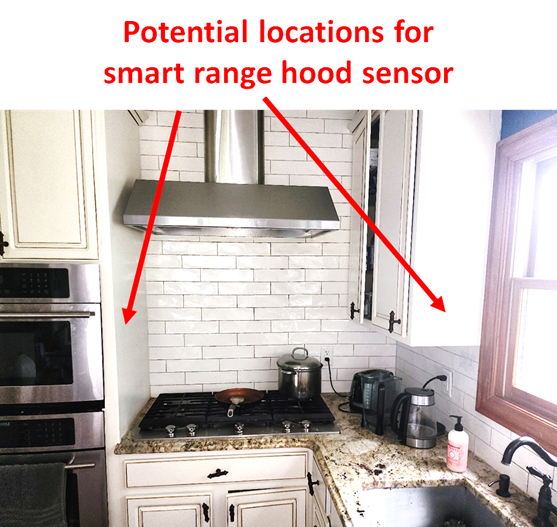
Smart residential range hoods that include particle sensors and/or other sensors such as infrared cooktop surface sensors are commercially available. In most cases, these sensors are factory-installed in the range hoods and thus the builder or homeowner does not need to determine placement. If an aftermarket sensor is installed, it should be located near the range, but not so near that it is subject to accumulation of grease. Figure 8 below shows example locations for aftermarket range hood sensors. For more information on range hoods, see the Building America Solution Center guide Kitchen Exhaust Fans.
Source
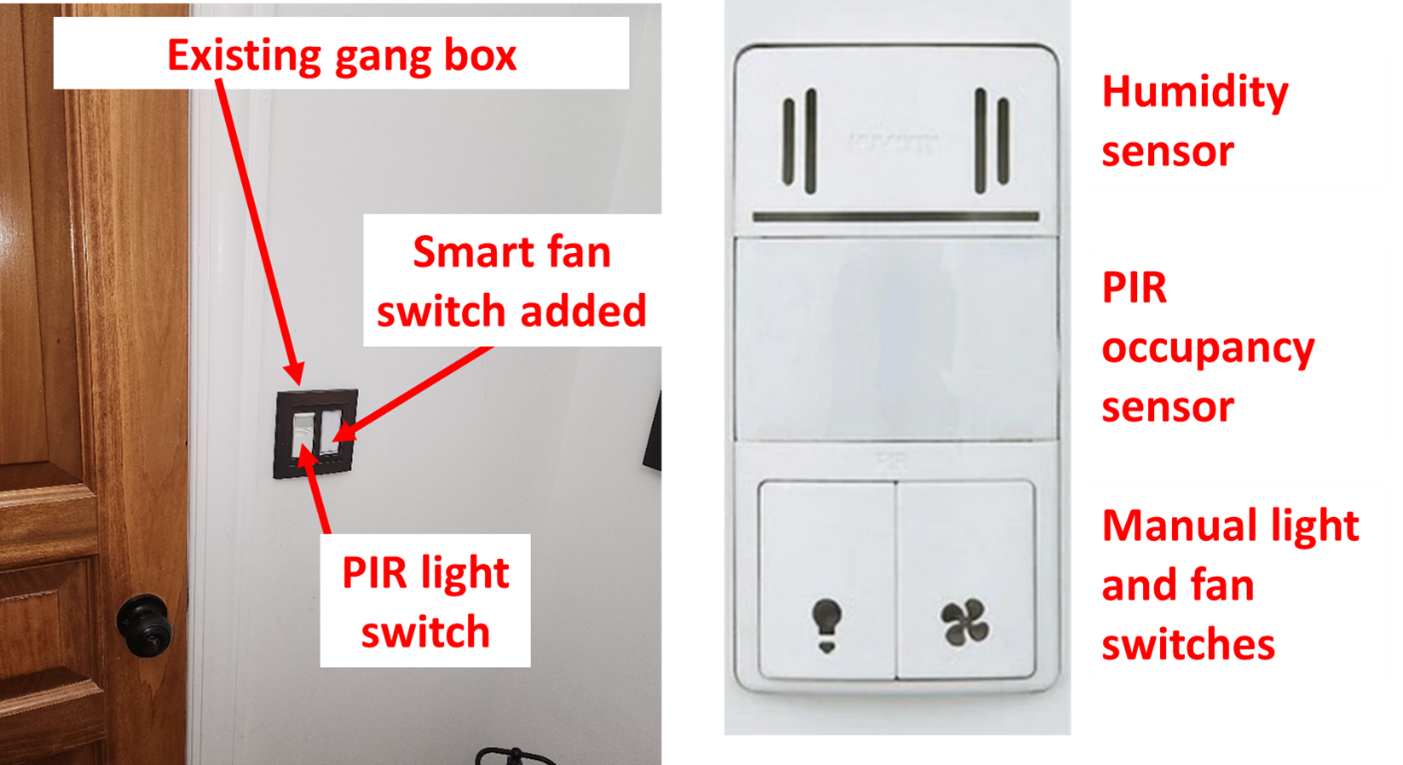
Bathroom Fan Activation
Bathroom fans are effective at removing pollutants generated in the bathroom before they enter the greater home space. Examples include perfumes, cleaning supply fumes, and body odors. Bathroom fans can be integrated with controls, such as manual switches, moisture sensors, and occupancy sensors.
The most common locations for bathroom controls are:
- Integrated with the bathroom fan. In this case sensors are powered via the hardwired connection to the bathroom fan and no further set up is needed. In most cases, signals from these sensors are sent directly to the fan and are not visible to the end user. The user often must specify a relative humidity threshold and a runtime following activation via a knob on the fan.
- Integrated in the switch for the bathroom fan (Figure 9). Smart switches can be tied to humidity sensors, passive infrared occupancy sensors, and manual switches and can be programmed to turn on the bathroom fan whenever any of the three is activated. Installation is identical to other smart switches. A neutral line must be present in the gang box.
- Stand-alone DIY (do-it-yourself) solutions are possible through interfacing apps, but this also requires a smart switch and is likely to be more complex and expensive than buying a switch with a humidity sensor and a passive infrared (PIR) occupancy sensor built in.
For more information on bathroom exhaust fans and their controls, see the Solution Center guides Bathroom Exhaust Fans and Continuously Operating Ventilation and Exhaust Fans.
Filter Unit Activation
Standalone filtration units that incorporate an integral particle sensor have been commercially available for several years. In most cases, these implement either deadband control that will activate the device once a threshold concentration has been crossed and then turn it off once a lower threshold concentration is reached; or they simply run for a set amount of time after a high concentration is recorded.
Standalone filtration is most often done on a room-by-room basis. Therefore, if the standalone filter unit does not include an integral sensor for activation, an independent sensor should be placed within the same room and linked to the device. Again, sensors should be placed near breathing zones as much as possible. Placing sensors near the floor (such as on the filtration device itself) is not advisable since concentrations of particles near the ground are often considerably greater than those that occupants are exposed to. This highlights the fact that sensors integrated within cabinet filter units (which typically sit on the floor) are not ideally located. Alternatively, if the source of particles is known (such as a fireplace), sensors should be placed near this source.
Central Filtration Activation
In homes with ducted heating and cooling systems, the central filter located in the cabinet of the furnace or air handling unit can be used to reduce the magnitude and duration of short-lived, high-concentration events. At least one consumer device is commercially available that interfaces with both a consumer IAQ monitor and the home’s thermostat. This monitor can be used to activate the central fan in “recirculation mode” or “fan-only mode” when a high concentration of particles is measured at the sensor. This will force return air through the furnace or air handler filter, removing particles from the indoor air. Guidance on sensor placement for this application is as follows:
- If the source of the particles is unknown: Place the sensor at the height of the occupants’ breathing zone on the wall in frequently used rooms.
- If the source of the particles is known: Place the sensor near the source of the particulates.
Communication for this system is from the sensor to the cloud via the home's Wi-Fi network and from the cloud to the smart controller via Wi-Fi. Users must connect the controller to the furnace unit and thermostat according to the manufacturer’s instruction, and the monitor is simply plugged into an outlet in the room where occupants spend the most time.
Ventilation Control
As discussed previously, care should be taken to locate ventilation intakes away from potential sources of pollution, such as idling trucks or garbage cans. However, some situations occur during which all outdoor air is worse than indoor air, such as wildfires or during high traffic periods in urban areas.
To prevent poor-quality outside air from worsening indoor air quality, particle sensors can be used to close dampers or turn off fan motors when the PM threshold is reached. These devices can be placed just inside of the intake grilles or dampers, away from potential driving rain. This can be done as a normal, ongoing precaution or in response to specific events or seasons when outdoor air is considerably worse than indoor air.
Occupancy-Based Demand Control
When buildings are unoccupied, concentrations of pollutants matter much less, and ventilating or cleaning air continuously may be wasteful. Studies have shown as much as 40% of the energy used for ventilating homes can be reduced if ventilation fans operate in response to an occupancy signal (Clark et al. 2019 and Less et al. 2019). One popular control method is passive infrared sensors (common in many commercial bathrooms) that can be installed by homeowners inexpensively. Additionally, geofencing integrated with occupants’ cell phones and smart thermostats is an effective strategy. CO2 can also be an indicator of occupancy, although its efficacy is often reduced because of lag while CO2 levels build up to meet the threshold, by which time occupancy may have changed. CO2 sensors in bedrooms and common spaces can indicate which parts of the home require ventilation. CO2 sensors are integrated in one such control product available commercially in the United States. Occupancy sensors, if used, should be located in the locations at which they are most likely to sense the occupants as they enter the building or the locations of the home in which occupants spend the most time, such as living rooms and bedrooms.
It should be noted that occupancy-based control strategies are expected to be more energy efficient in hot humid climates than in cold climates. That’s because occupants are most often present in residences at night, and overnight is the least-energy intensive time to ventilate in hot climates during the summer, but the most energy intensive time to ventilate in cold climates during the winter.
Garage Exhaust Fan Control
Vehicle exhaust in garages is a common source of CO. In shared garages that have mechanical exhaust systems, HVAC designers may choose to interlock the operation of the garage exhaust fans with CO sensors.
Some voluntary energy-efficiency programs, such as ENERGY STAR New Homes and Apartments, may even require that garage exhaust fans be controlled by CO sensors.
See the International Mechanical Code (IMC) for additional details on requirements for garage fans that are interlocked with CO sensors. For additional information on mechanical exhaust systems in multifamily garages, see the Building America Solution Center guide on Mechanical Exhaust for Multifamily Garages.
Ensuring Success When Integrating Sensors with Mechanical Ventilation Controls
If installing a sensor to control a ventilation device, ensure that it is installed per manufacturer instructions.
Sensor-actuator complexity will vary for different applications. In some cases, a sensor must simply be attached to the wall and set up with an app-based wizard. In other cases, professional installation is recommended. In many cases, a custom solution can be made with compatible devices and actuators by using interfacing apps. For example, many smart switches or smart outlets can be made available by a signal from one of these apps. This signal can come from a manual input by the user, a scheduled input by the user, or in response to an input signal (such as that of a consumer IAQ sensor). See Table 1 for an outline of different control and sensor options.
Table 1. Applications for Integrating IAQ Sensors with Ventilation Controls
| Category | Application | What is measured | Where to measure | Action Taken | Market Uptake | Communication | Power |
| Long-Term Monitoring | Baselining, rating, compliance | CO2, particles | Prominent place where occupants reside, away from sources | No automated action. Can inform retrofits | In practice | WIFI | 110V AC outlet or rechargeable batter for portable devices |
| Filter monitoring | particles | Upstream and downstream of filter in furnace cabinet (can be primary supply duct and return duct) | No automated action. Filter change by owner when necessary | Niche | WIFI | 24V via thermostat wire from air handler | |
| Ventilation Control | Smart range hoods | particles | Within range hood or on wall nearby | Range hood activated | Niche | Hard-wired or Bluetooth. Manual switch can still effectively remove particulates. | Hard-wired to hood or 110V AC |
| Bathroom fan activation | RH | Integrated with bathroom fan or on wall | Bathroom fan activated | In practice | Hard-wired or Bluetooth; can be controlled with moisture or occ. sensor or manual switch | Hard-wired to fan, hard-wired to 110V AC in gang box or plugged into outlet | |
| Filter unit activation | particles | Within filter unit or on wall away from sources | Filter unit activated | In practice | Hard-wired to fan.
| ||
| Central filtration activation | particles | Prominent place where occupants reside, away from sources, such as near thermostat | Central furnace run in recirculation-only mode (no heat or cool) | Very niche but growing | Sensor data to cloud via WIFI, actuation signal to thermostat via WIFI | Hard-wired to fan via 24V thermostat wire | |
| Ventilation shutdown | Particles, NOx | Ventilation intakes | Shut intake damper when outdoor conditions poor | Rare | TBD | TBD | |
| Garage exhaust fan control | CO, NO2 | Installed by specialist | Reduced fan operation when CO and NO2 levels are low | In practice | Installed by specialist | Installed by specialist | |
| Occupancy-based demand control | CO2 or other measure of occupancy | In room(s) where occupants reside within view of occupants-can be multiple rooms | Ventilation damper opened/closed | Very niche but growing | Sensor data to cloud via WIFI, actuation signal to thermostat via WIFI | Existing solutions use 24V hard wired from thermostat |
Ensuring Success
General Recommendations
- In many cases, absolute concentrations of pollutants output by consumer monitors may not be perfectly precise or accurate. However, trends in concentrations relative to reference times or conditions can still be informative. When possible, prioritize trends over numerical absolutes.
- If manufacturer guidance to the contrary is not provided, annual calibration is recommended. This could be done by comparing sensor output with the output of a new sensor or a more expensive sensor that is assumed to be correct. Some manufacturers offer mail-in calibration services. Sensors in dirtier environments such as outdoor air intakes and unfiltered, uncleaned return ducts are likely to require more frequent servicing than those in clean environments.
- For guidance in selecting reliable IAQ sensors, see Lawrence Berkeley National Laboratory’s Consumer Indoor Air Sensor Evaluation or the Air Quality Sensor Performance Evaluation Center (AQ-SPEC).
- Follow recommendations from the EPA on how to reduce your exposure to common indoor air pollutants.
Calibration Drift vs Replacement
Even sensors that produce out-of-the-box precision and accuracy are known to drift considerably over time. This is especially true with CO2 sensors. Some manufacturers have built calibration routines into their devices to address this. However, this provision itself can add challenges. For example, many CO2 monitors periodically (and silently) recalibrate themselves such that the least concentration experienced over some time period, say a week, is considered to be the outdoor concentration of 400 ppm, and the other concentrations are scaled accordingly. However, this assumes the outdoor concentration is fixed, which is not the case, and may create problems in residences where occupants rarely leave. Consumers should be alert for nonsensical data such as CO2 concentrations under 400 ppm or very high concentrations when no one is home. Such readings may indicate an erroneous self-calibration or age-related drift that takes the unit outside of specification.
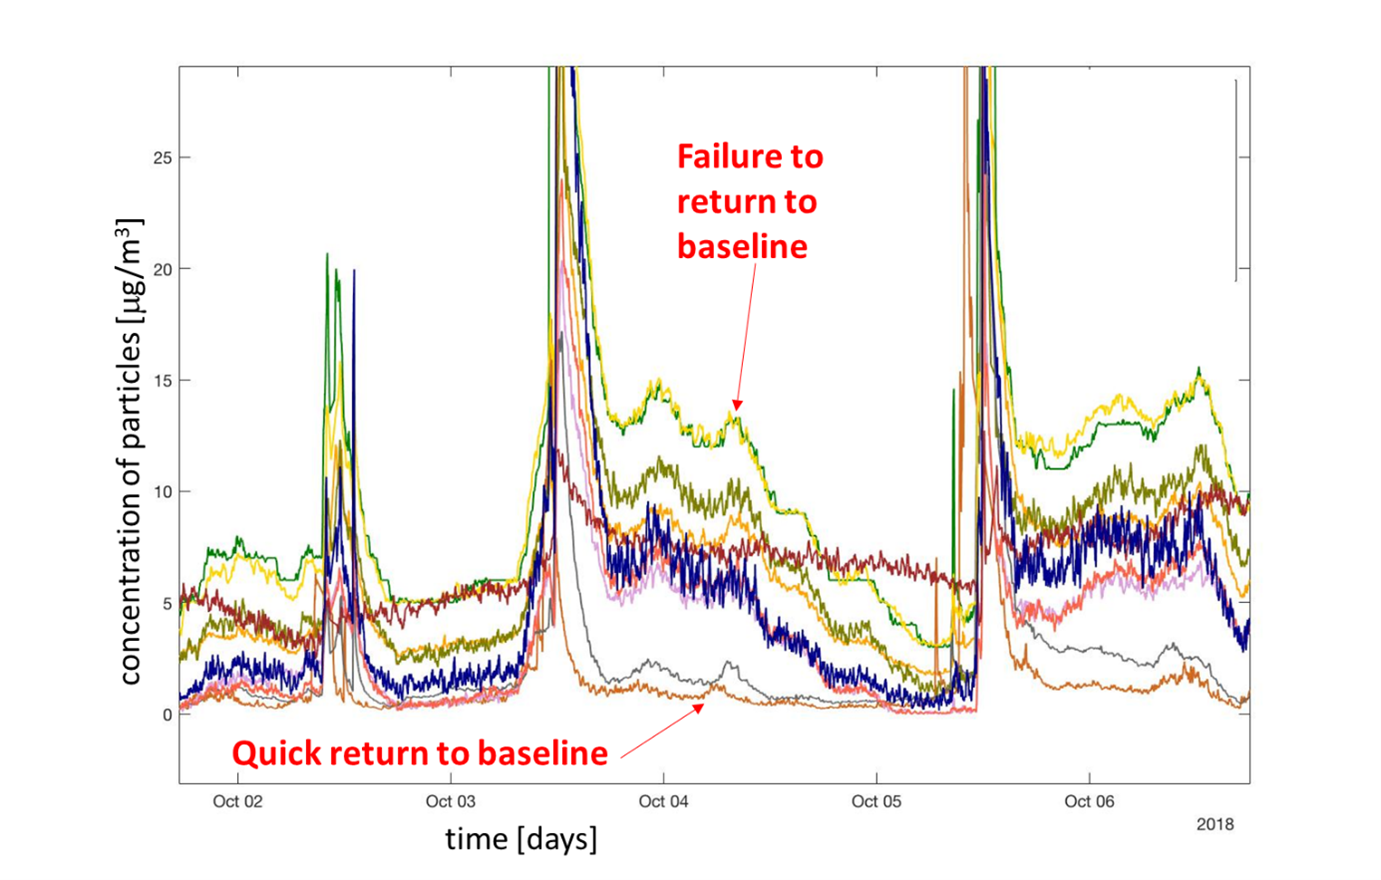
Failure to Return from an Event
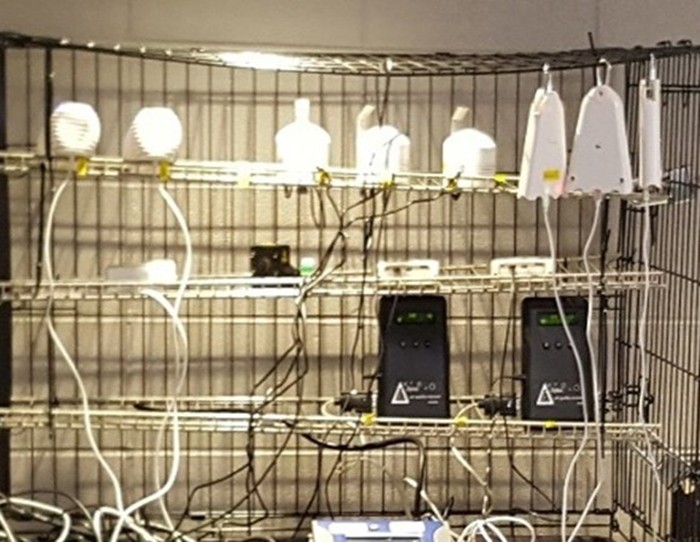
Consumer monitors have notoriously experienced failure (unexpected lag) to return to proper operation after a high-polluting event such as cooking. Manufacturers of many of the best-performing sensors have taken strides to alleviate this problem, but the problem may still persist for certain devices or for certain measurements within a device. Figure 1 shows this phenomenon clearly by illustrating the outputs of ten consumer particle sensors before, during, and after some typical emission events. All of the sensors were installed in the same location. Only two of the ten sensors quickly returned to low concentrations after the event was over, while seven of the ten improperly remained at artificially elevated concentrations for hours, and one remained high for days. This is a common problem and is indicative of a sensor error, not a problem with the home.
Source
Lower Limits of Quantification, Especially for Formaldehyde
Another typical limitation of low-cost consumer sensors, especially for individual gases, is an inability to measure very low concentrations. For example, formaldehyde measurements as low as 10 parts per billion may be associated with health risks. However, at these low concentrations, the inherent noise in the sensor drowns out any signal and the resulting readings are of very little use. This problem has largely been alleviated for good quality particle sensors at concentrations greater than a few µg/m3, but persists for individual gas sensors. Users should use caution in interpreting readings at very low concentrations.
Training
Videos
Compliance
More Info
References and Resources
*For non-dated media, such as websites, the date listed is the date accessed.
Questions? Comments? Contact our webmaster.