Building America Solution Center
Help
User
Log in
Register
Why Register?
Search
Apply
Secondary
Programs & Guides
Building Components
Guides A-Z
Existing Homes
Home Improvement Expert™
Disaster Resistance
DOE Zero Energy Ready Home
ENERGY STAR Certified Homes
EPA Indoor AirPlus
EPA WaterSense®
Resources
2021 IECC Assemblies
CAD Files
Case Studies
Code Briefs
Image Gallery
Presentations
Sales Tool
Videos
Publications & Research
Library
Research Tracker
Building Science Education
Building Science Advisor
EERE
»
BTO
»
Building America
»
Solution Center Home
» Image Gallery
Image Gallery
Showing results 1 - 6 of 6
Per page
50
100
250
- All -
Apply
Image
2018 Long-term National Seismic Hazard Map
View Image
Download
Image
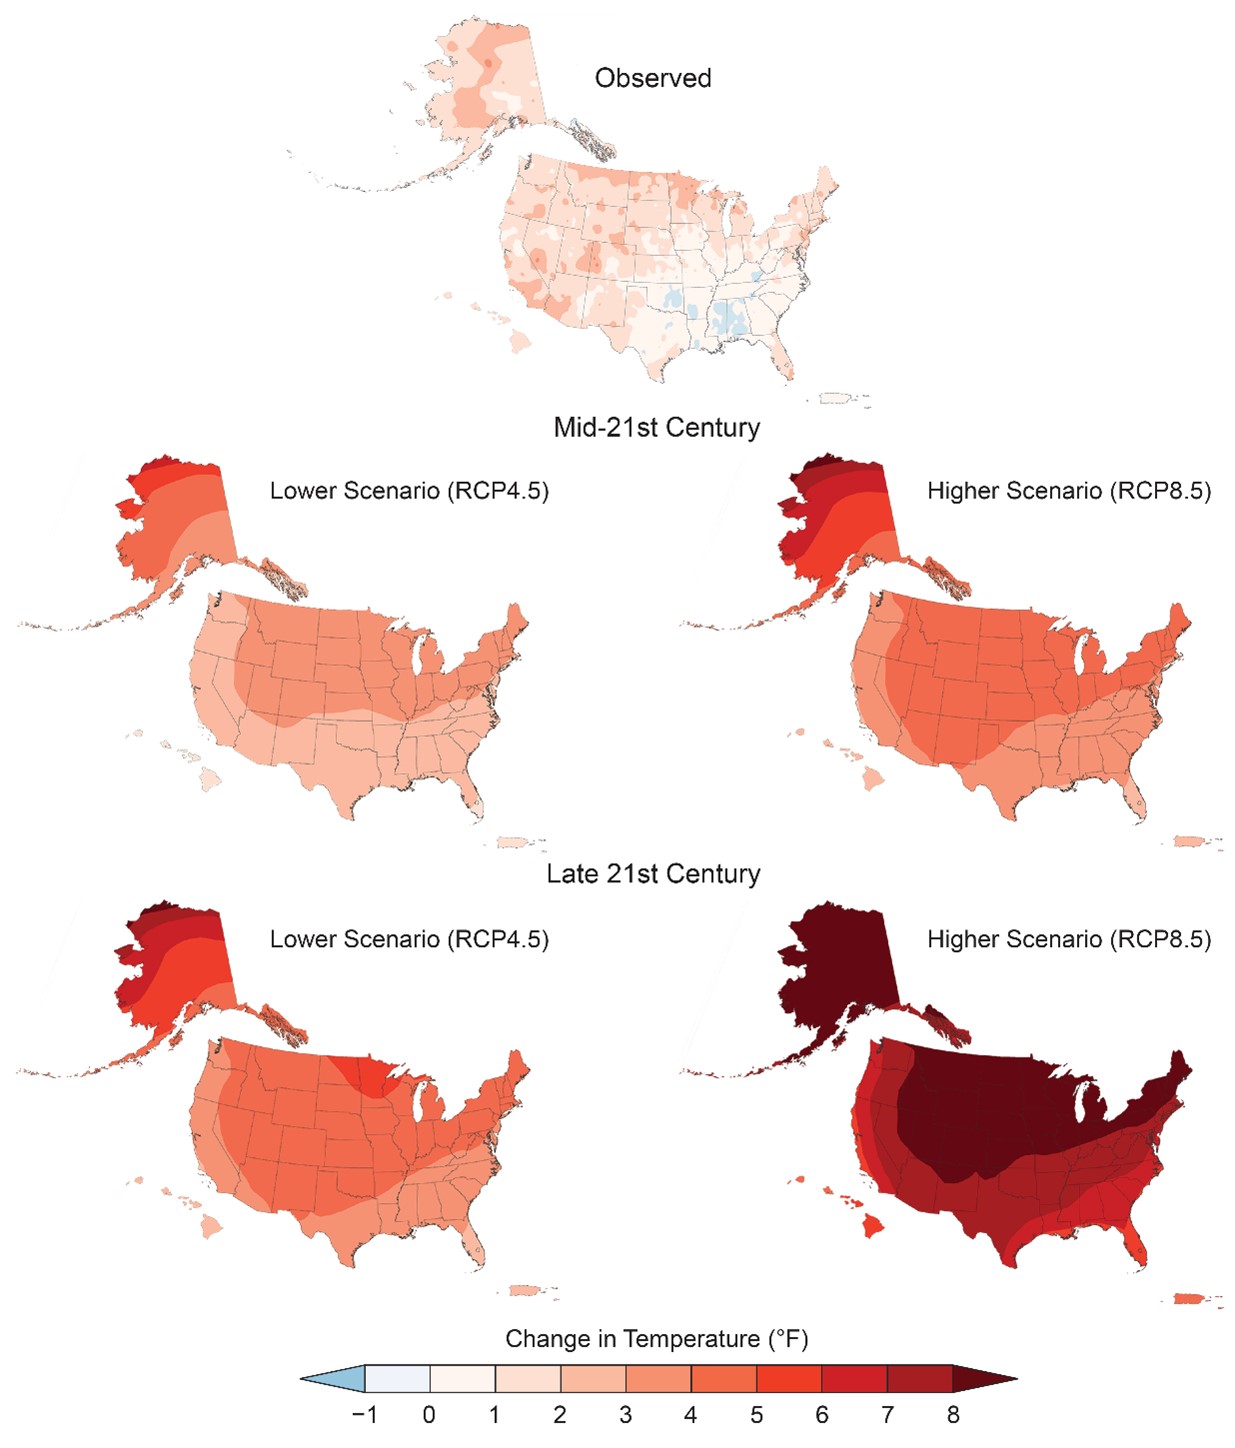
Annual average temperatures have increased across North America when comparing the present day to the first half of the last century, and are projected to increase for mid-century and end-of-century relative to the near-present
View Image
Download
Image
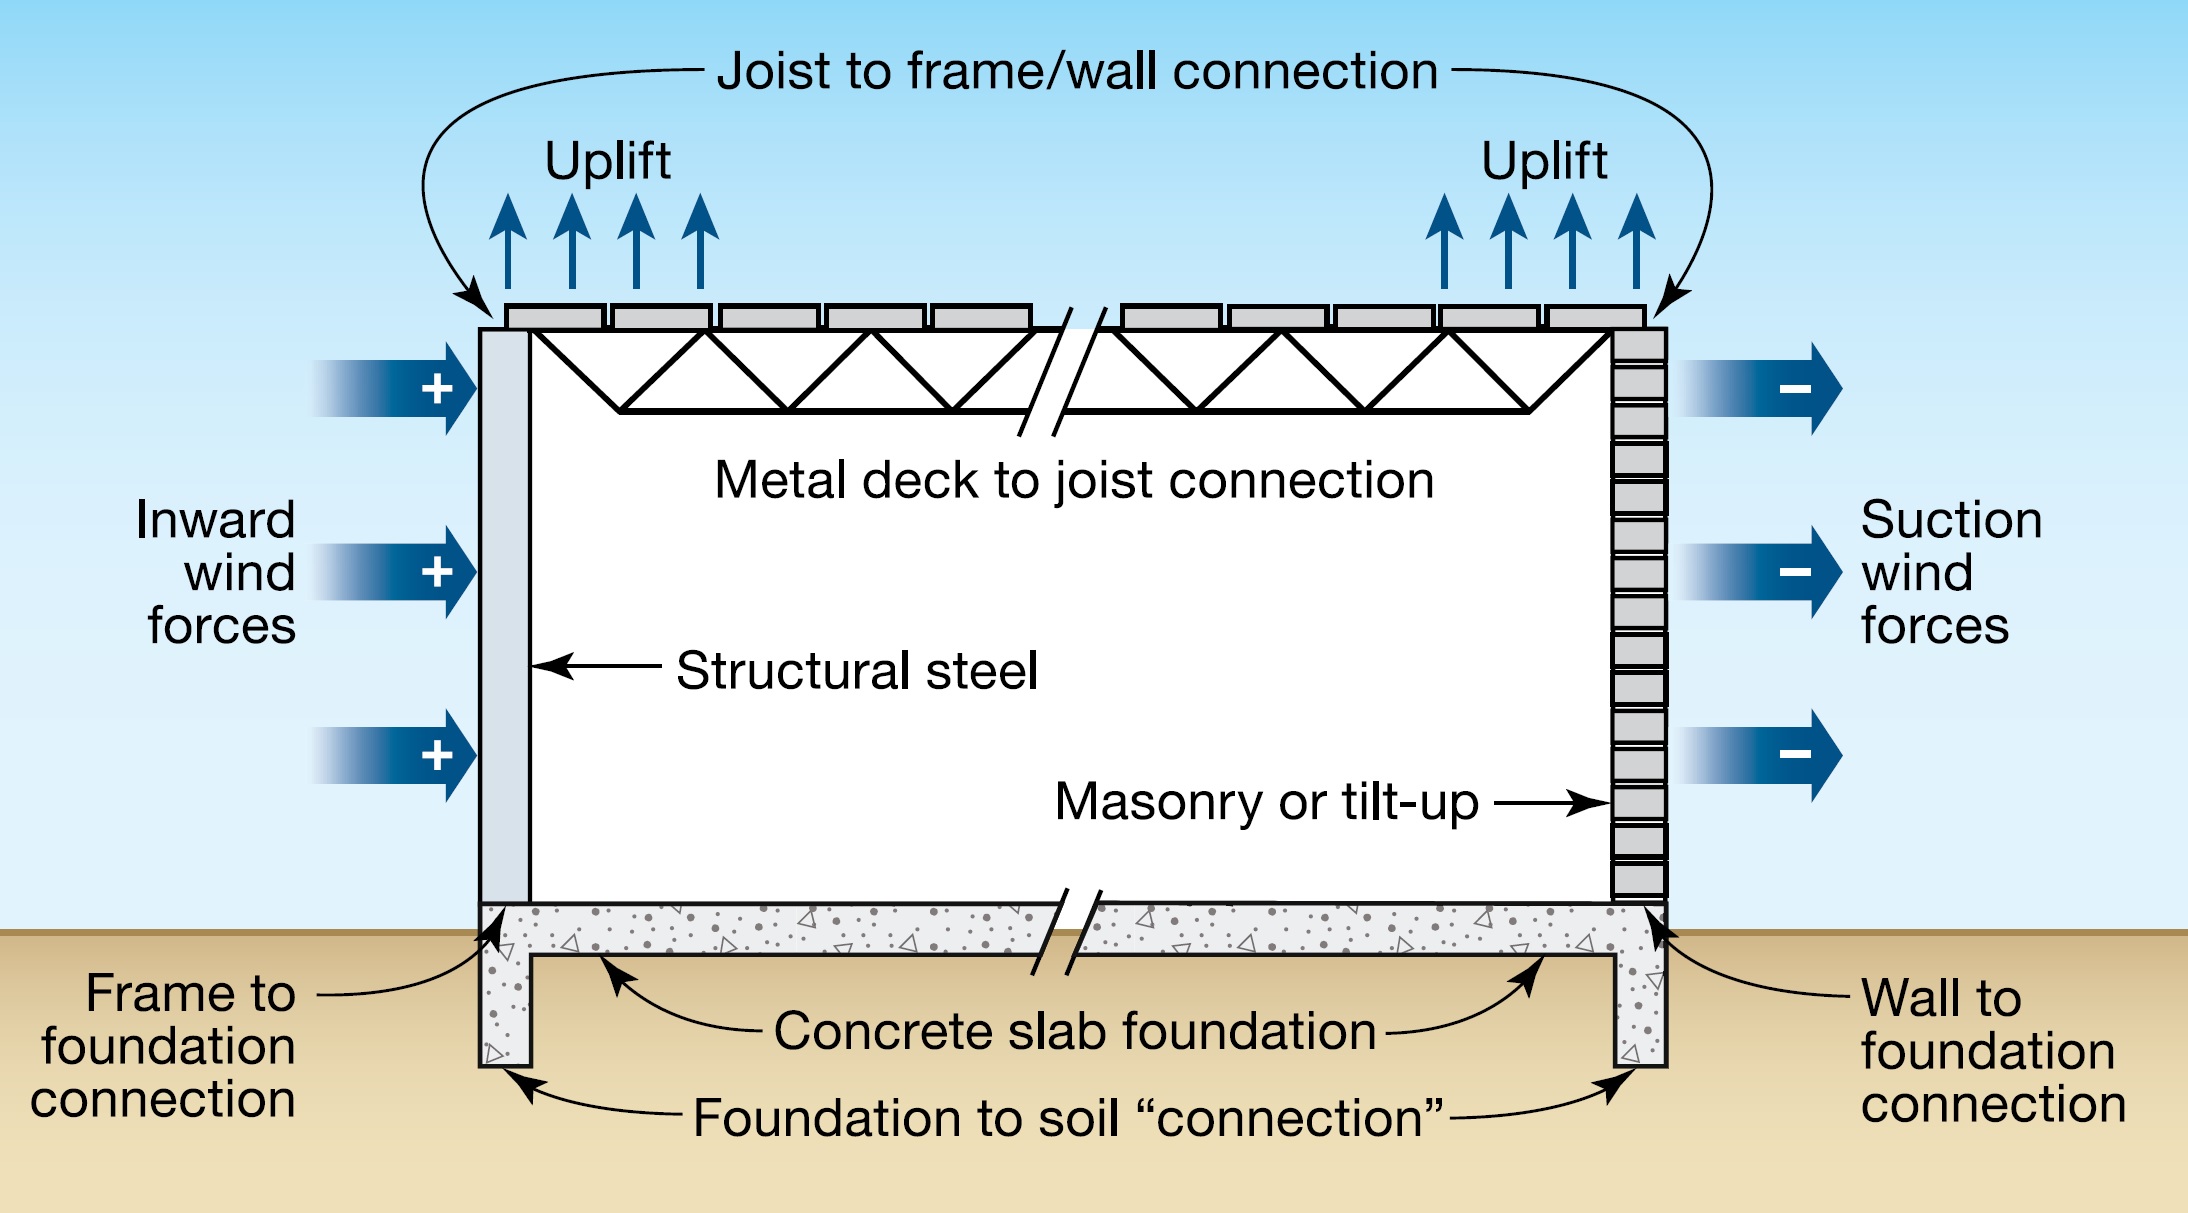
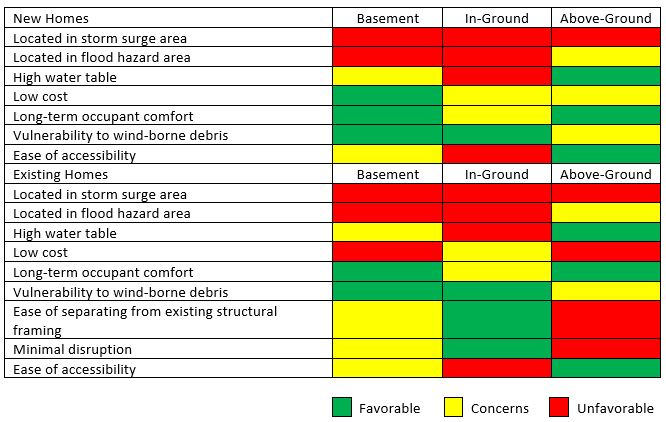
Critical connections for providing a continuous load path in buildings and storm shelters
View Image
Download
Image
Interior and exterior safe room locations for slab-on-grade foundations.
View Image
Download
Image
Safe Room Location Factors for New and Existing Homes
View Image
Download
Image
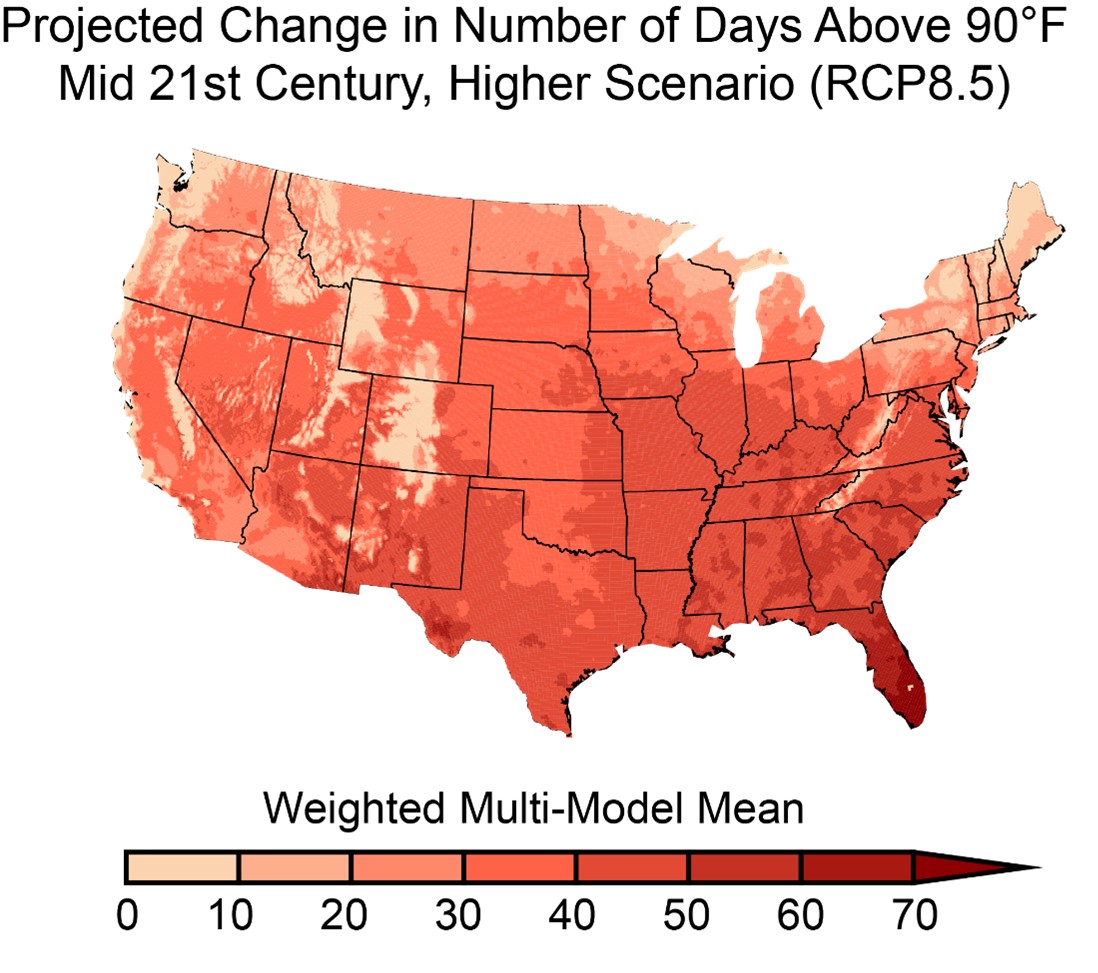
The number of days per year that the temperature exceeds 90°F is expected to increase throughout the contiguous U.S. when comparing mid-century (2036-2065) to near-present (1976-2005)
View Image
Download