EERE »
BTO »
Building America »
Solution Center Home
» Image Gallery
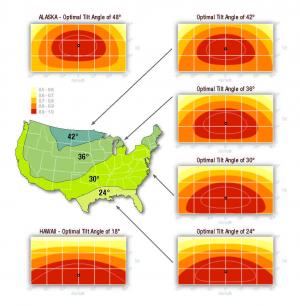
» Charts showing percentage of solar energy available in each US region as tilt and azimuth change
